What Is GDP and How Is It Measured?
9 min read
You hear it in almost every economic headline: the economy grew, the economy shrank, the figures beat expectations. Behind most of those statements sits a single number. So what is GDP, and why does one figure carry so much weight? In plain English, GDP, or gross domestic product, is an attempt to measure the total value of everything a country produces over a set period. It is the closest thing economists have to a scoreboard for a national economy, which is why governments, central banks, and news outlets pay it so much attention.
The idea sounds simple, but the details are where the confusion creeps in. GDP is not a measure of how much money exists or how wealthy a country is overall. It is a measure of activity, specifically the value of goods and services produced within a country’s borders during a given stretch of time. This guide breaks the concept down piece by piece, shows how the figure is actually put together, and explains what it can and cannot tell you.
What is GDP? A plain-English definition
Gross domestic product is the total market value of all the finished goods and services produced inside a country during a specific period, usually a quarter or a year. Each part of that definition is doing real work, so it is worth unpacking.
- Total market value means everything is added up using the prices people actually pay, which lets you combine very different things, such as haircuts, cars, and software, into one number.
- Finished goods and services means only the final product counts. The flour sold to a bakery is not counted separately from the bread, because counting both would tally the same value twice.
- Produced inside a country means location matters, not ownership. Output made within a country’s borders counts toward its GDP, even if the company involved is foreign-owned.
- During a specific period means GDP is a flow measured over time, not a stock sitting in a vault. It captures activity across months or a year, then resets for the next period.
Put those together and you have the core answer to what is GDP: a snapshot of how much a national economy produced, expressed as a single monetary figure that can be tracked and compared over time.
How GDP is measured: the three main approaches
One of the reasons GDP is trusted is that it can be calculated in three different ways that, in principle, all arrive at the same total. Each approach looks at the economy from a different angle.
The expenditure approach
This is the most widely cited method. It adds up all the spending on final goods and services in the economy. Because one person’s spending is another person’s income, total spending should capture the value of everything produced.
The income approach
This method adds up all the income earned from producing those goods and services, including wages paid to workers, profits earned by businesses, rent, and interest. The logic is that producing something generates income for someone, so summing incomes should match the value of output.
The production (or output) approach
This method adds up the value added at each stage of production across every industry. Value added is the difference between what a business sells its output for and what it paid for the inputs it used. Summing value added avoids counting the same thing twice and reveals how much each sector contributes.
In a perfect measurement, all three would produce an identical figure. In practice small discrepancies appear because the data comes from different sources, but the three-way check is part of what makes GDP a robust indicator.
The expenditure formula, step by step
The expenditure approach is worth walking through because it appears constantly in economic coverage. It breaks total spending into four categories, often summarised with the shorthand C + I + G + NX. Here is how the pieces fit together:
- Consumption (C). Start with household spending on goods and services, from groceries and rent to phone plans and restaurant meals. In most economies this is the single largest component.
- Investment (I). Add business spending on things that help future production, such as machinery, buildings, and equipment, along with new housing. Note that “investment” here means real productive assets, not buying shares.
- Government spending (G). Add government spending on goods and services, such as paying public employees and building roads. Payments like pensions or benefits are generally excluded here, because they are transfers rather than payment for new production.
- Net exports (NX). Add the value of exports, then subtract the value of imports. Exports are counted because they were produced domestically; imports are subtracted because they were produced elsewhere.
Add those four together and you get GDP by the expenditure method. The formula makes it easy to see what is driving a change: a rise in consumer spending, a surge in business investment, or a shift in the trade balance will each move the headline number.
Nominal vs. real GDP: why the difference matters
A common trap is treating a rising GDP figure as automatic proof that an economy is producing more. It might simply mean prices went up. To handle this, economists distinguish between two versions of the number.
- Nominal GDP measures output using current prices. If prices rise across the board, nominal GDP can climb even when the actual quantity of goods and services produced has not.
- Real GDP adjusts for price changes by valuing output using the prices from a fixed reference year. This strips out the effect of inflation, so any increase reflects genuine growth in production.
When you hear that an economy “grew” by a certain amount, the figure being quoted is almost always real GDP, because that is the version that tells you whether the country actually produced more rather than just charged higher prices. This is also why real GDP is the standard yardstick for comparing an economy’s performance from one year to the next.
What GDP does not tell you
GDP is powerful, but it was never designed to measure everything, and treating it as a complete score for a society leads to mistakes. Understanding its blind spots is part of understanding what is GDP in the first place.
- It ignores distribution. A rising GDP says nothing about who receives the gains. An economy can grow while many households see little benefit.
- It misses unpaid work. Activities such as caring for family members or volunteering produce real value but involve no market transaction, so they are largely left out.
- It says little about well-being. Health, leisure, environmental quality, and general life satisfaction are not captured by a production figure.
- It can count harmful activity. Spending to repair damage after a disaster adds to GDP even though the underlying event made people worse off.
- It overlooks the informal economy. Unrecorded or off-the-books activity is hard to measure and may be undercounted, especially in some economies.
None of this makes GDP useless. It simply means the figure is one instrument on the dashboard, best read alongside measures of employment, inequality, prices, and environmental impact rather than on its own.
How GDP is used and why it moves markets
Because GDP condenses so much activity into one comparable number, it feeds directly into decisions that ripple through everyday life. Governments watch it to judge whether their policies are working and to plan budgets. Central banks weigh it when setting interest rates, since an economy that is growing quickly or slowing sharply may call for different responses.
GDP growth is also central to how economists define the broad health of an economy. A sustained fall in real GDP over consecutive quarters is one of the signals commonly associated with a downturn, which is why GDP releases are watched so closely. Investors react to the figures too, because the pace of growth shapes expectations for company profits, borrowing costs, and future policy. When a GDP report differs from what markets expected, prices for shares, bonds, and currencies can shift within minutes.
Comparisons across countries add another layer. Because a large economy will naturally have a bigger GDP than a small one, analysts often look at GDP per capita, which divides output by population, to get a rough sense of average economic activity per person. It is still not a measure of well-being, but it allows fairer comparisons between countries of very different sizes.
Frequently asked questions
Is a higher GDP always a good thing?
Not necessarily. A higher GDP means more was produced, but it says nothing about how the gains are shared, whether prices simply rose, or what the growth cost in other terms. Real GDP that grows steadily is generally viewed as healthy, yet it is best read alongside measures like employment, inequality, and inflation rather than treated as a complete verdict.
What is the difference between GDP and GNP?
GDP measures output produced within a country’s borders, regardless of who owns the businesses. Gross national product, or GNP, measures output produced by a country’s residents and companies, wherever in the world it happens. The two are closely related but count cross-border activity differently.
Why is GDP measured every quarter?
Measuring GDP quarterly gives governments, central banks, and businesses timely information about whether the economy is speeding up or slowing down, so they can respond without waiting a full year. Quarterly figures are often revised later as more complete data arrives, which is why an early estimate can change.
The bottom line
Once you can answer what is GDP, the economic headlines start to click into place. Gross domestic product is the total value of the goods and services a country produces in a period, measured through spending, income, or output, and reported in both nominal and inflation-adjusted real terms. It is the standard scoreboard for economic activity and a genuinely useful one, as long as you remember what it leaves out. Read it as a single, important instrument rather than the whole story, and it becomes one of the most revealing numbers in the news.
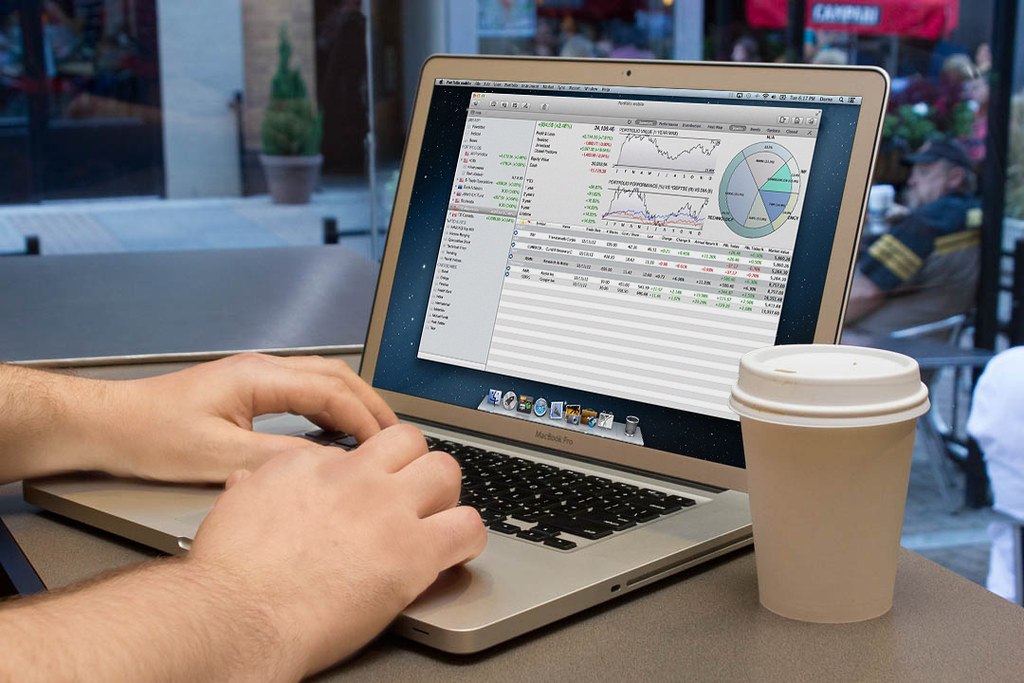
Featured image: Analyzing Stock Market — ota_photos (BY-SA) via Openverse